

My Role
UX Designer on a 10-person design team
Key Contributions
- Led competitive analysis and user research synthesis
- Created storyboards that defined product vision
- Designed interface components and interaction patterns
- Built and tested prototypes with users
- Presented research findings to executives
Project Scope
The Challenge
Our research with 87+ data professionals revealed three critical pain points:
Resource Discovery Crisis:
Data scientists spent countless hours finding trustworthy research papers and datasets with no quality validation.
Tool Fragmentation:
Every platform forces users to learn proprietary interfaces instead of using preferred languages and tools.
Collaboration Breakdown:
Projects were black boxes. Data scientists couldn't understand or build upon each other's work.
Data Science Process: As-Is Scenario
Current State Analysis of Data Science Workflow
Input Phase
Starting Point
Process Phase
Data Science Work
Output Phase
Final Results
Research & Discovery
To understand this complex problem space, we conducted extensive research across IBM's global design studios, interviewing 87+ data professionals through conferences, meetups, usability sessions, and contextual site visits.
Understanding Our Users
Mapping the Current Experience


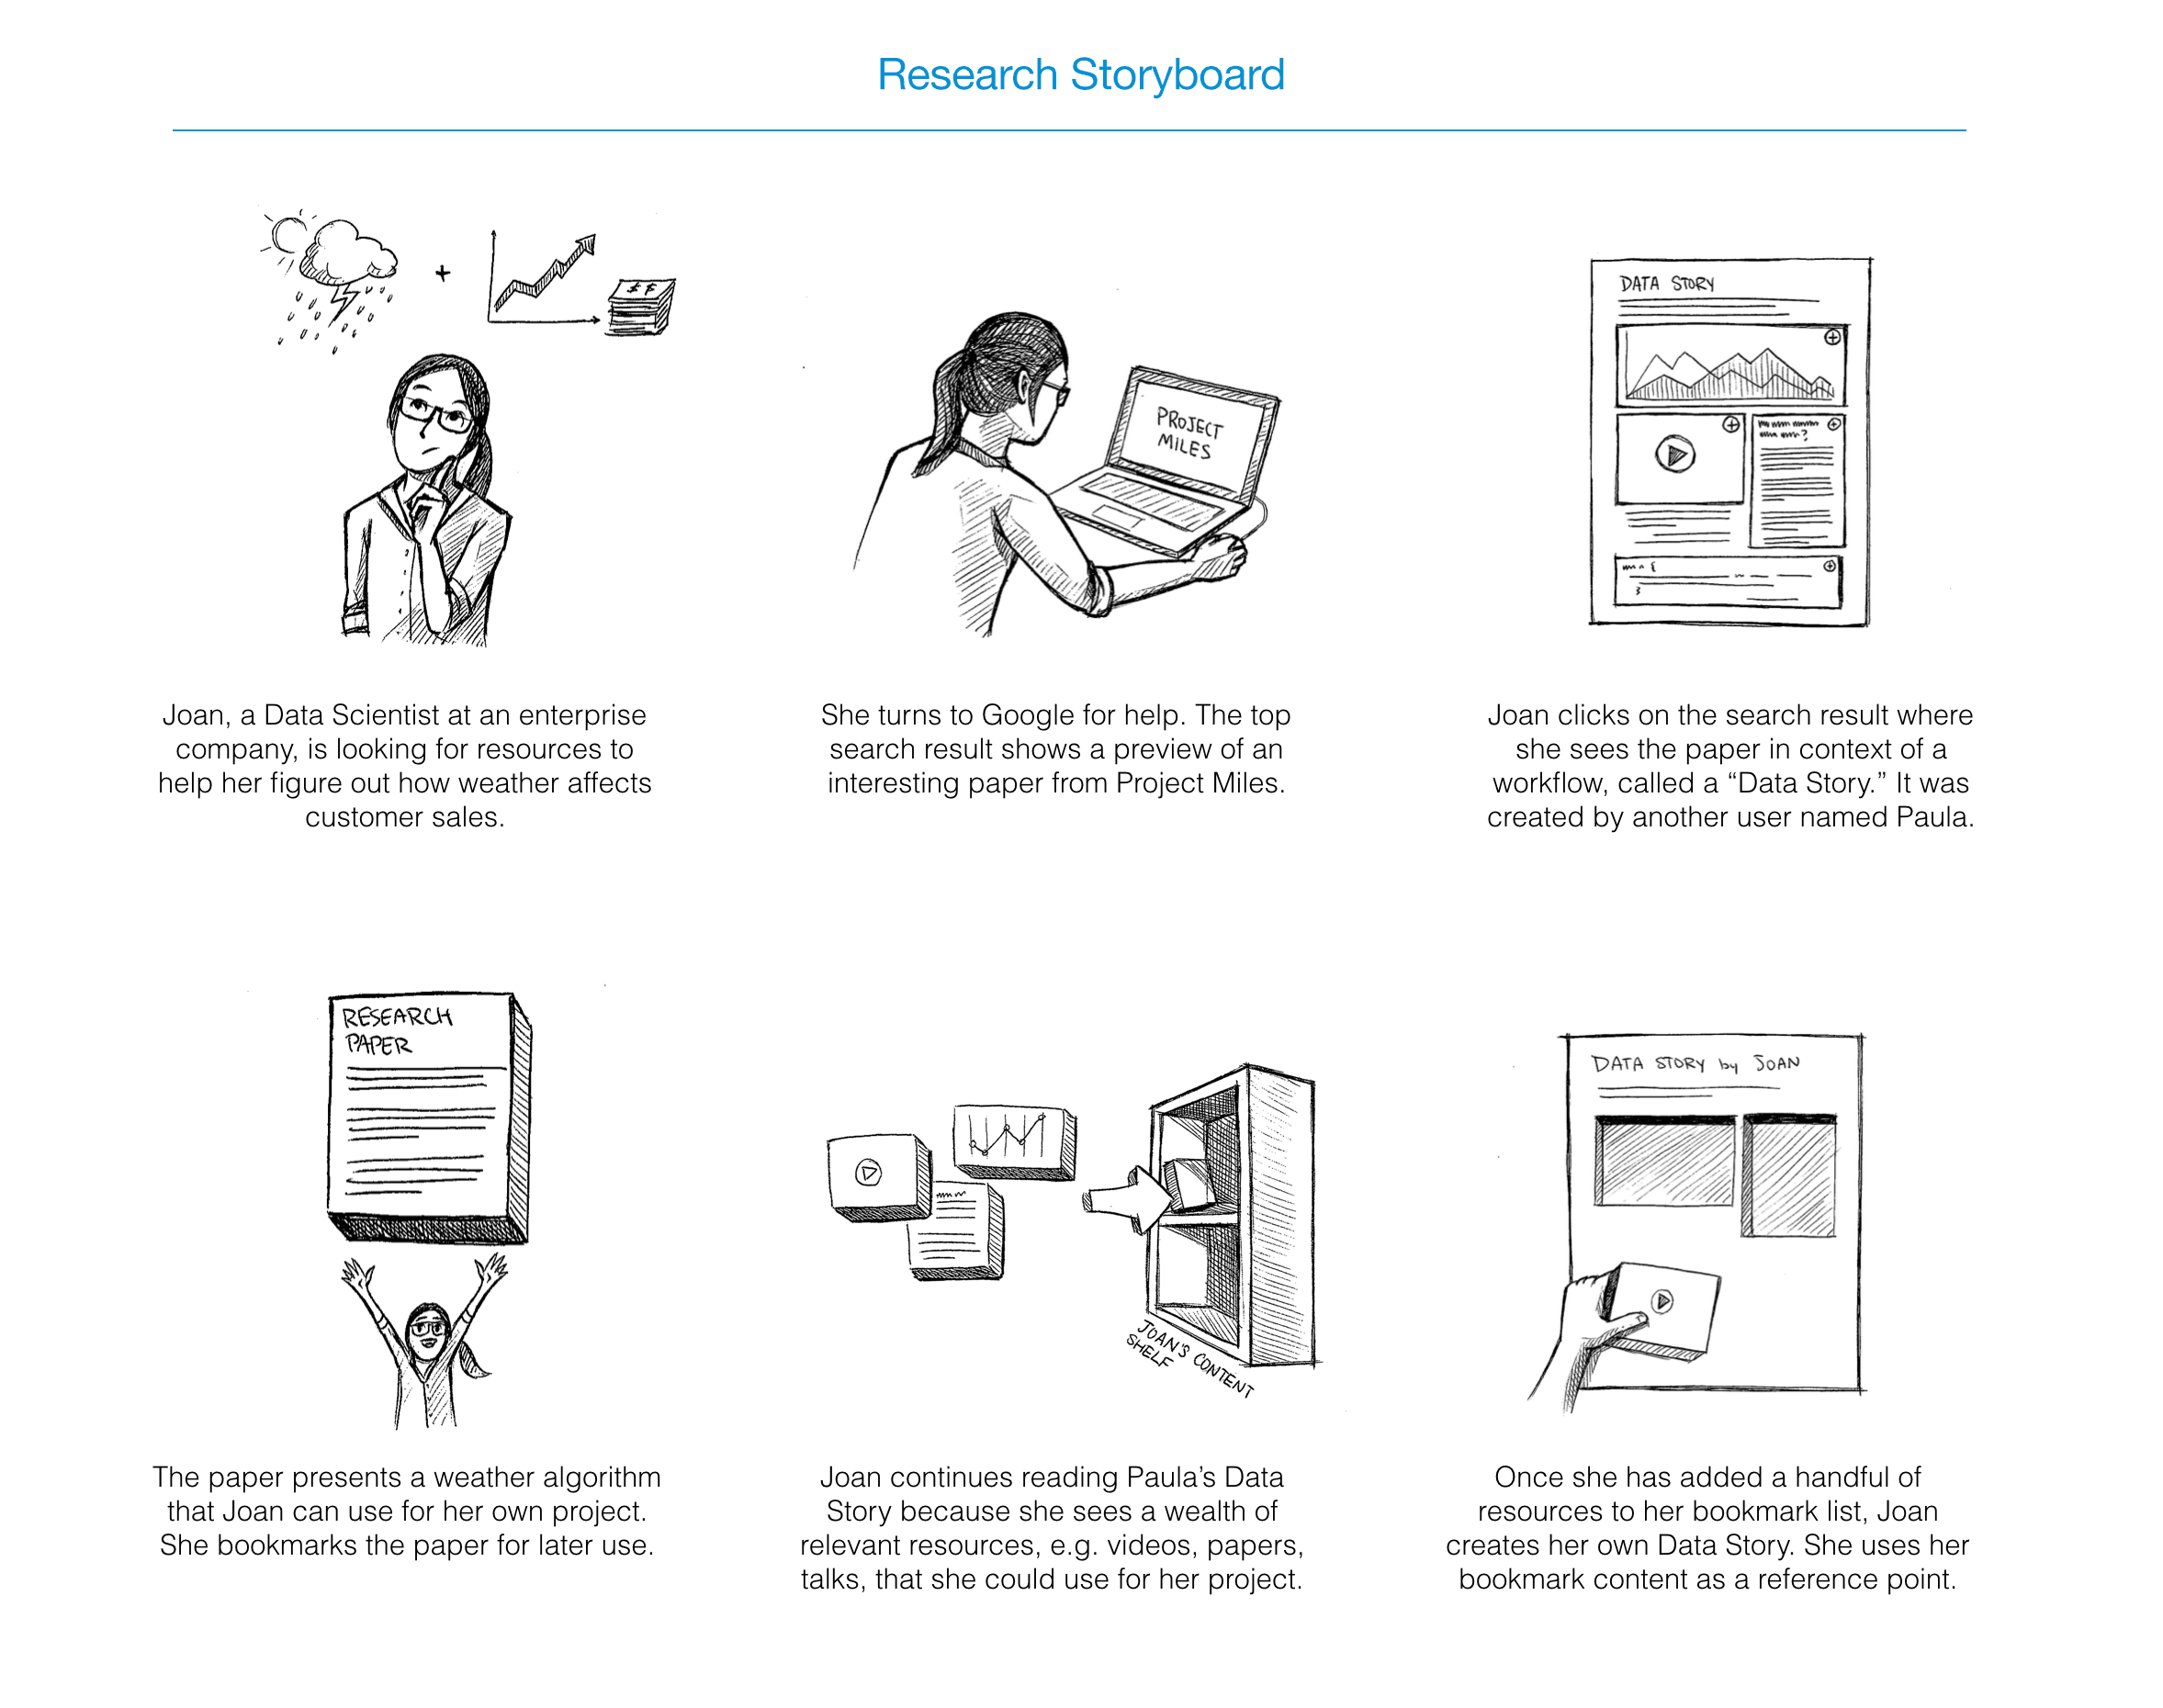
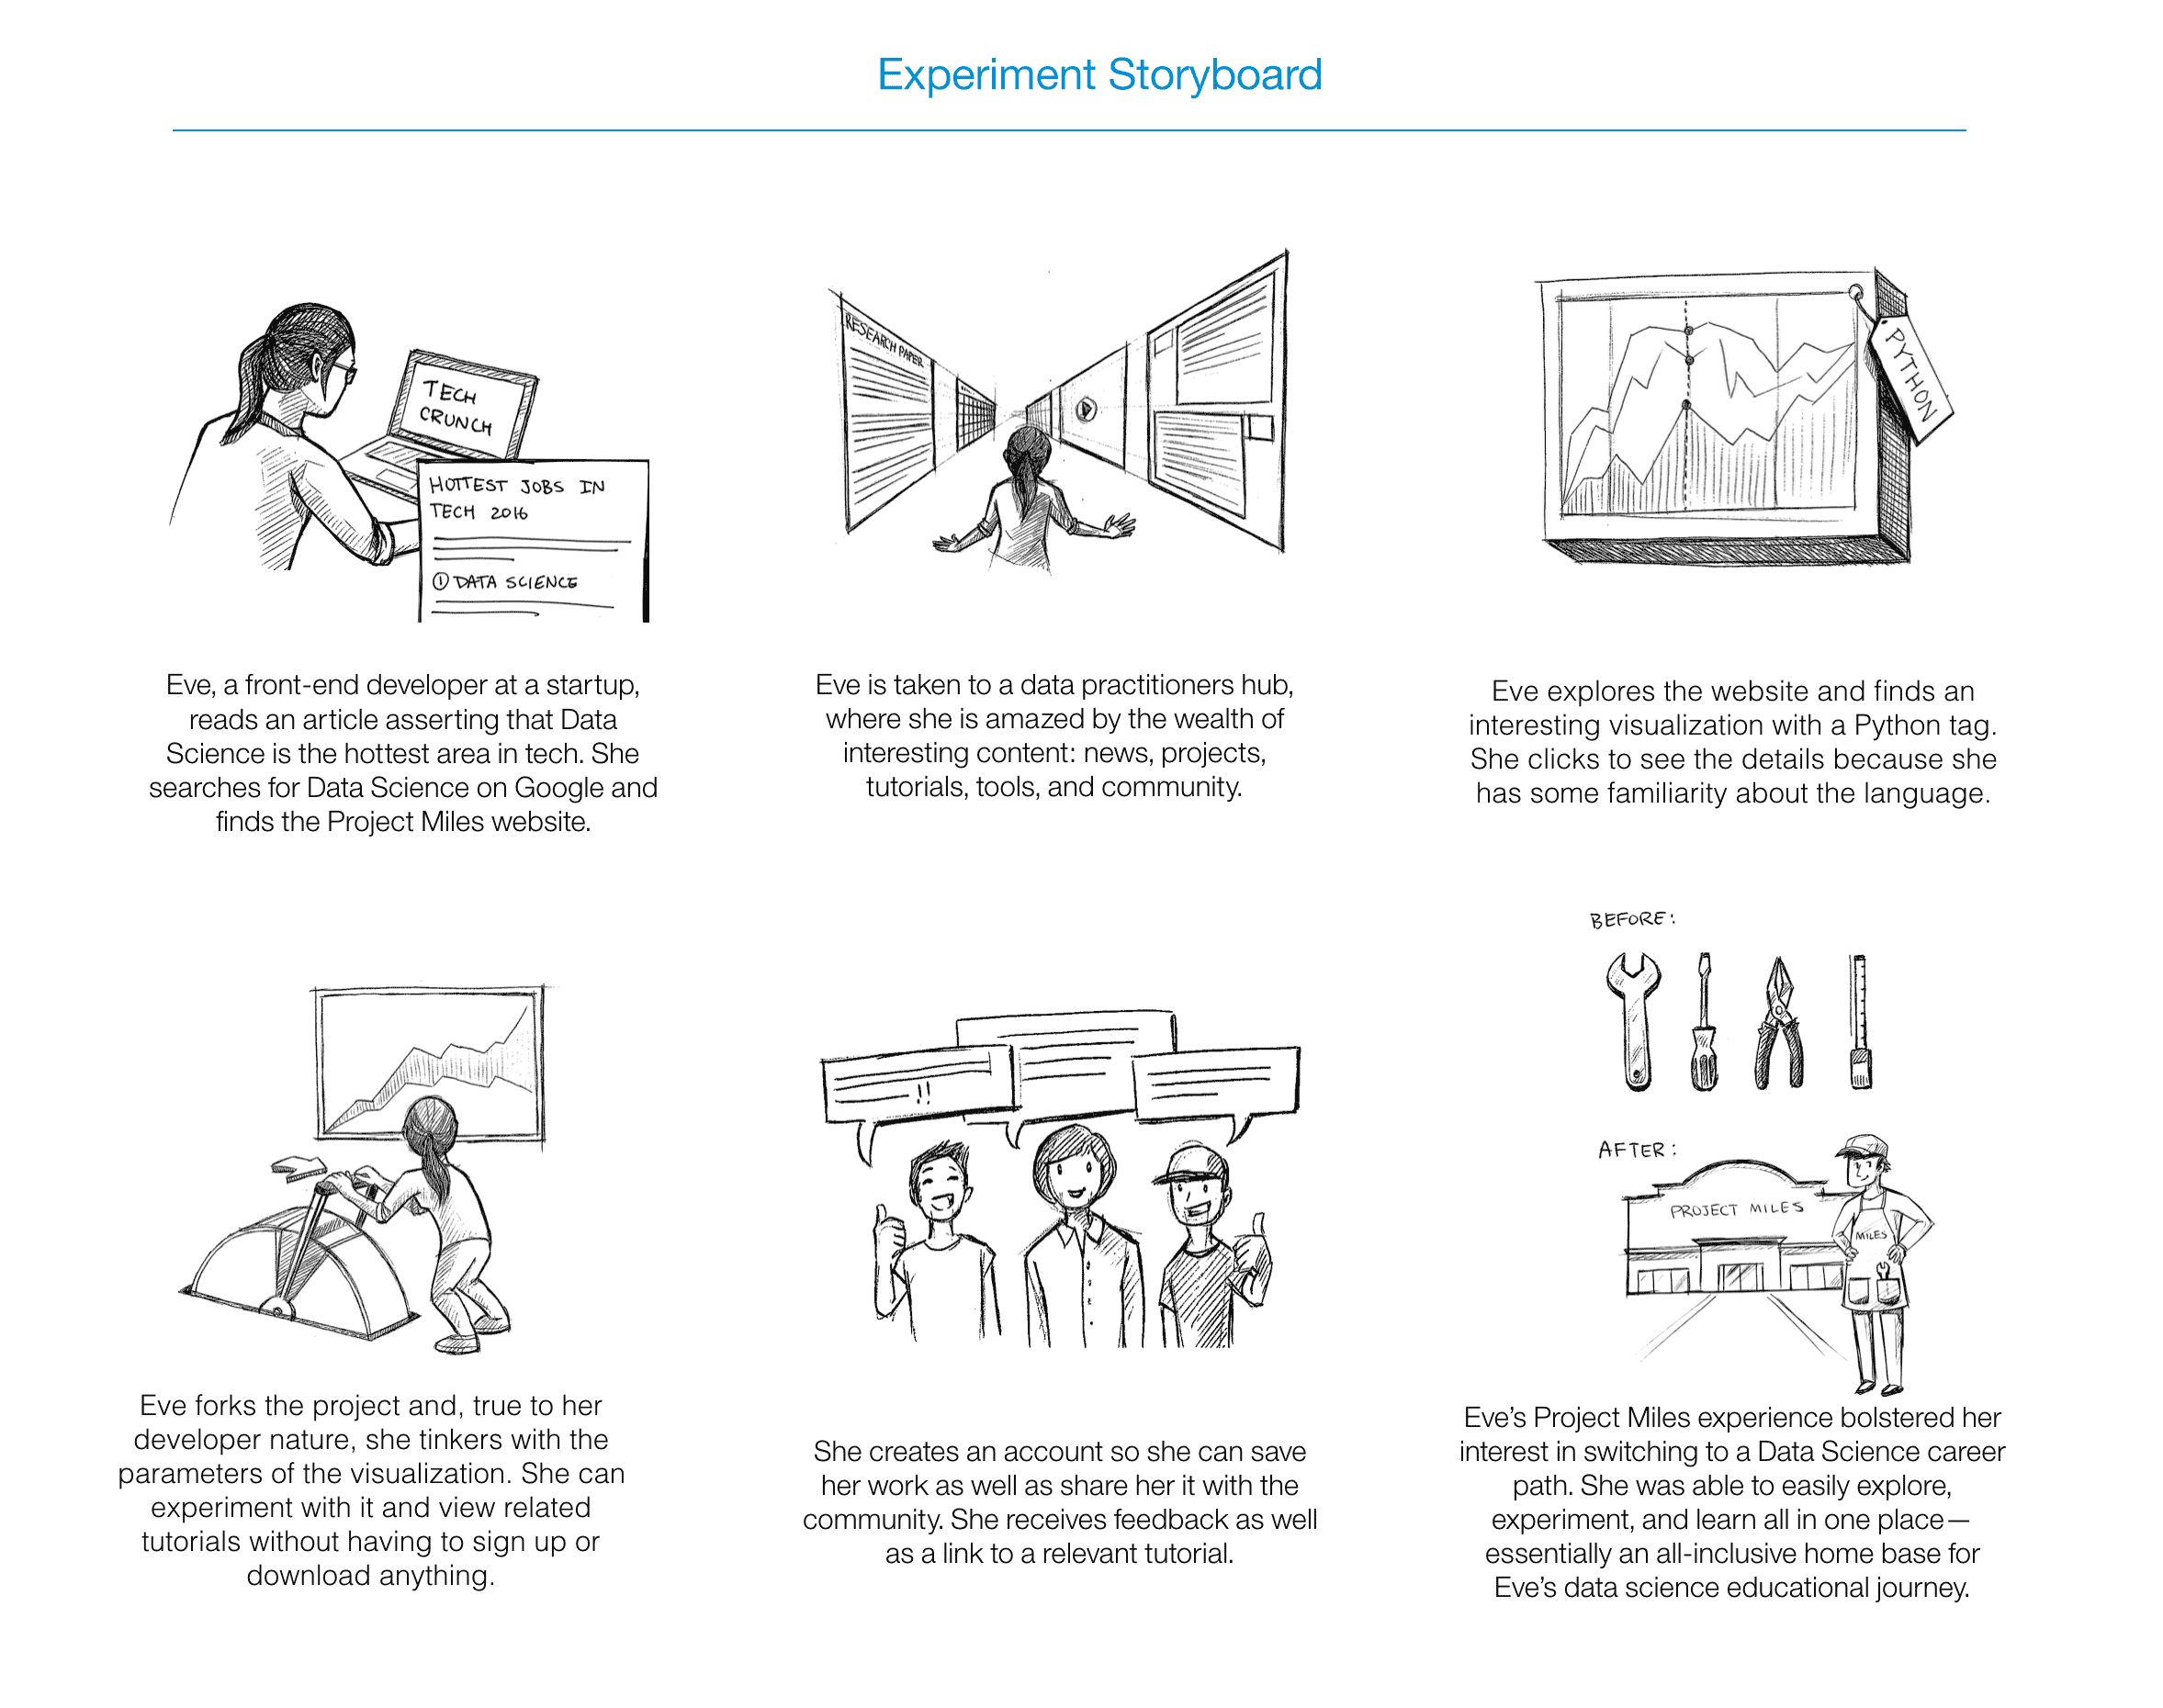
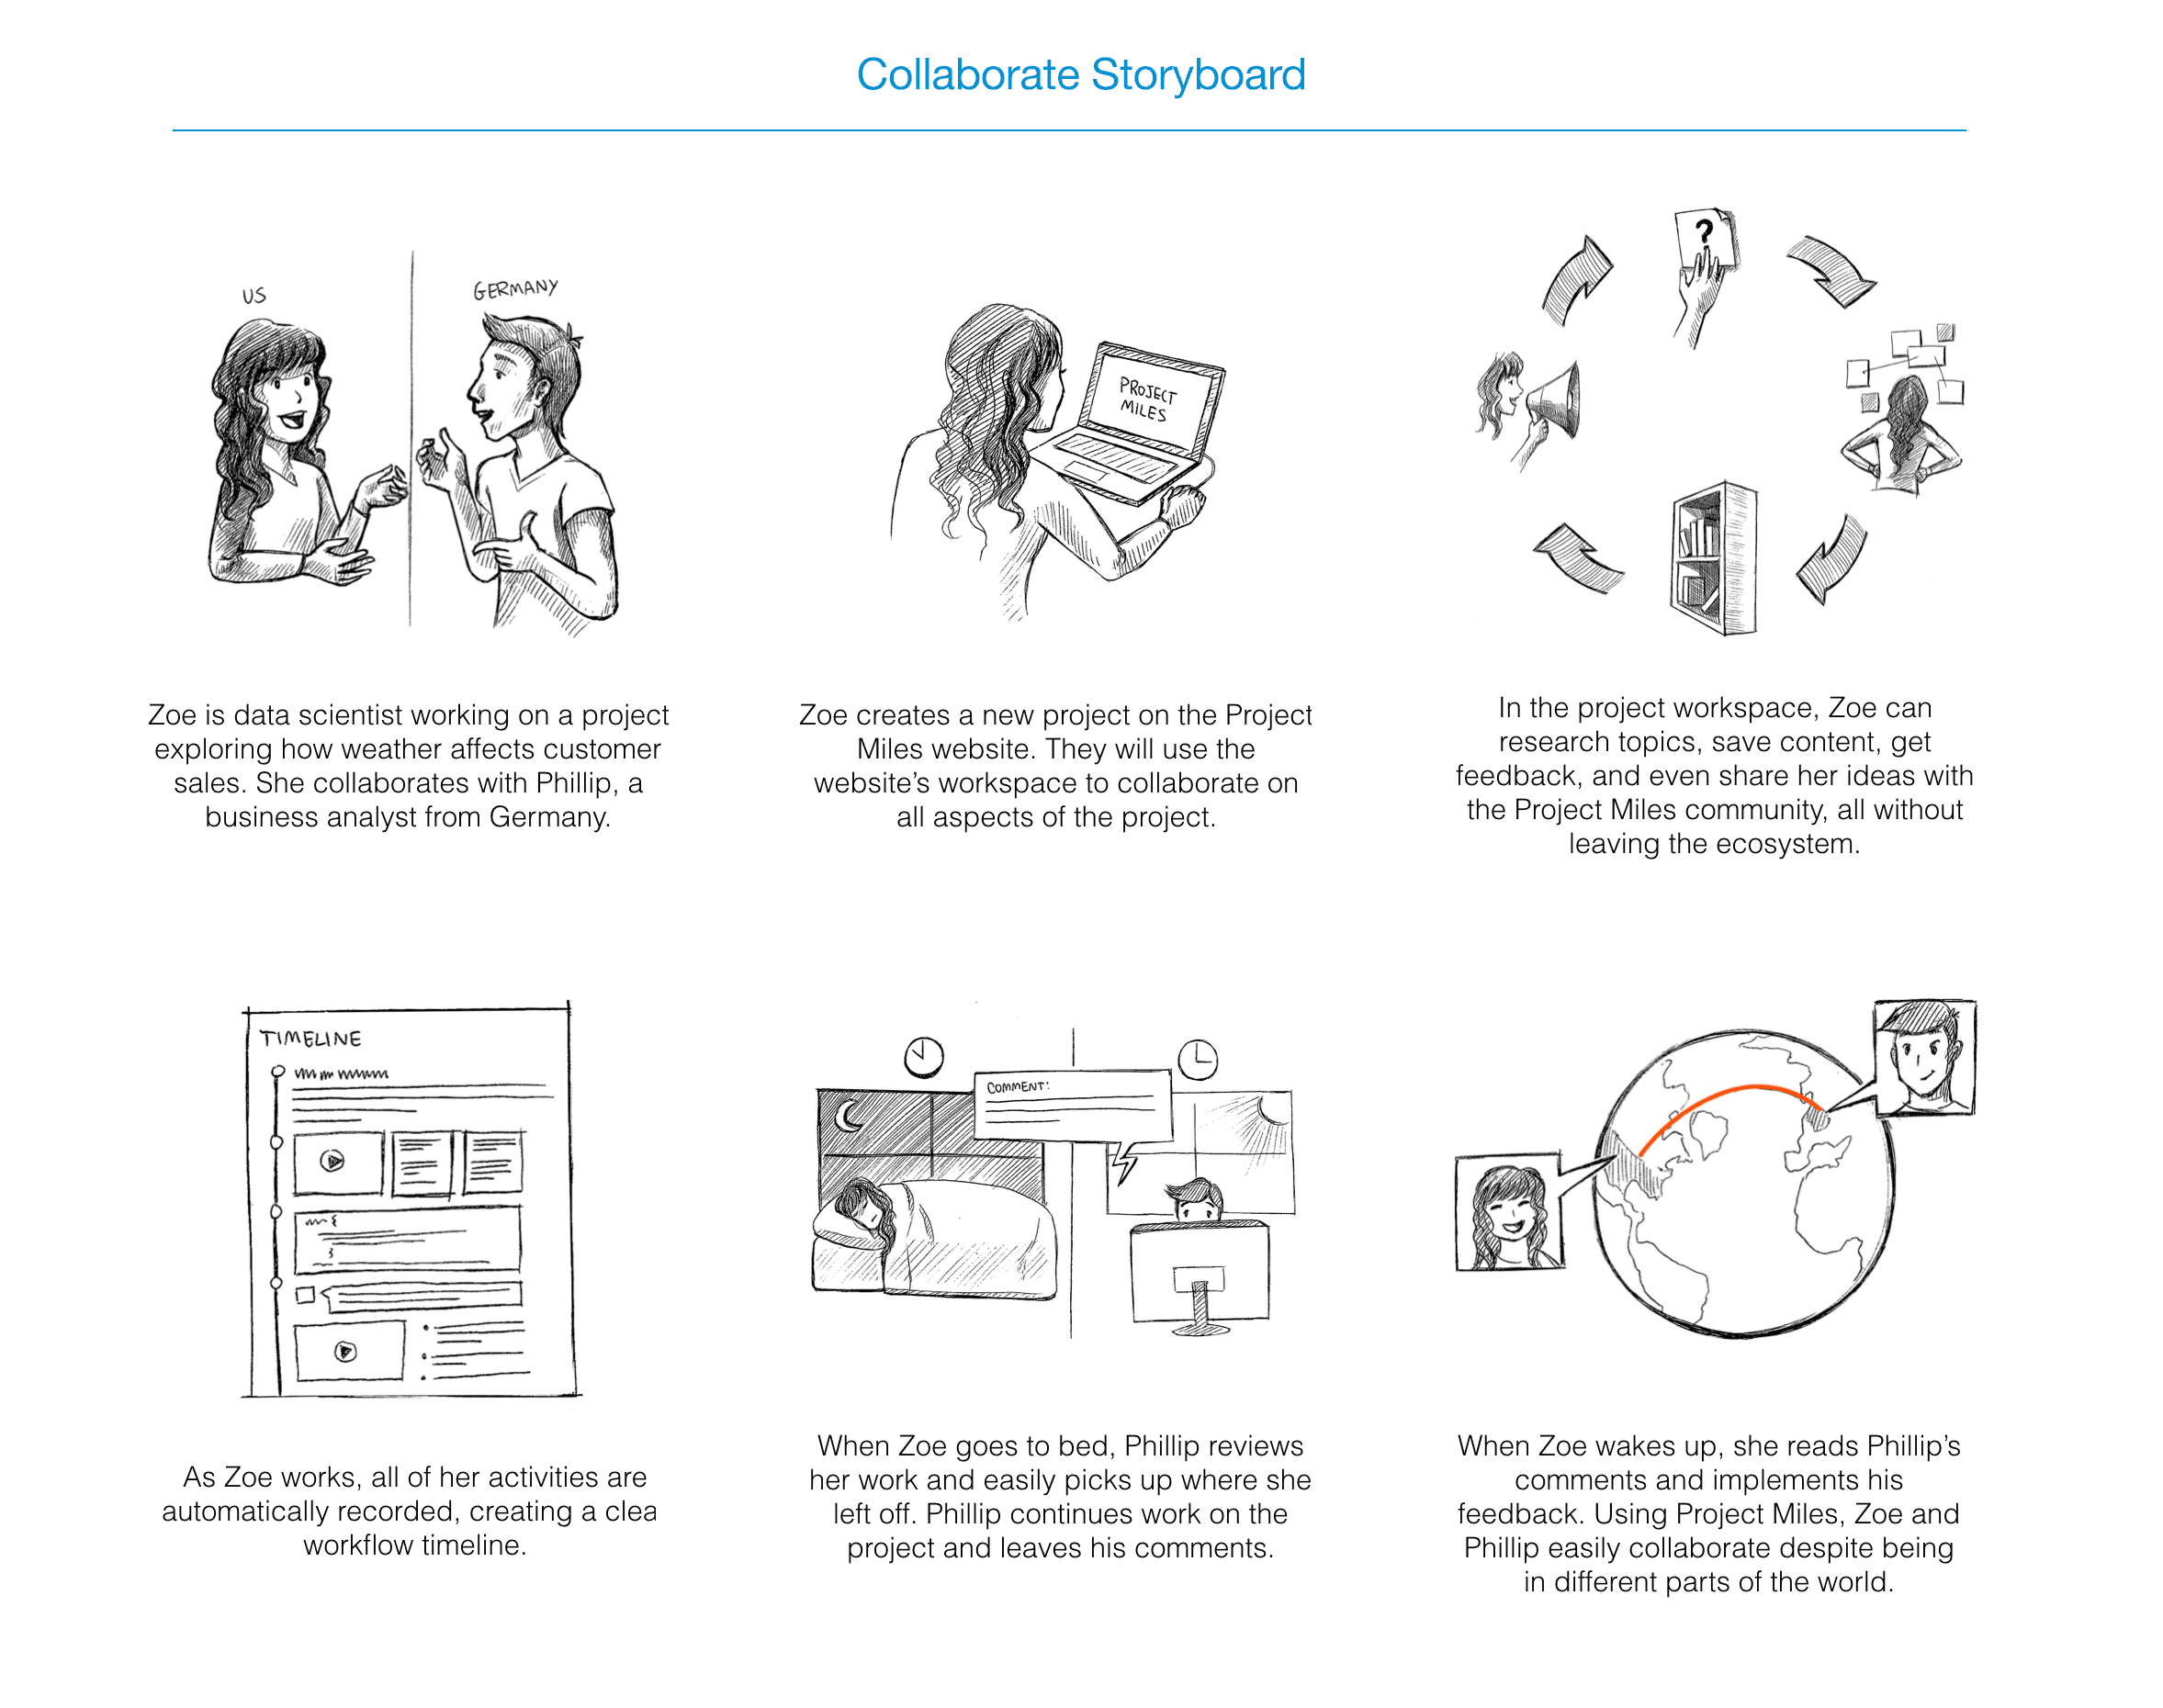
Bringing Ideas to Life Through Storyboards
Our team kicked off ideation by exploring high-level concepts through storytelling. After generating multiple ideas, we honed in on three promising directions that directly tackled the core pain points uncovered in our research. These concepts became the foundation for detailed storyboards illustrating how data scientists navigate their daily workflows around research, experimentation, and collaboration.
Crafting Real Scenarios
To ground our storyboards in reality, we developed four distinct characters representing nuanced variations of our primary data scientist and data engineer personas. Each storyboard zeroed in on a specific friction point:
Validating with Real Users
We brought these storyboards to a diverse group of practicing data scientists and engineers, inviting them to share honest reactions and personal experiences. Their insights, both validating our assumptions and challenging our approach, became the crucial input that shaped our design direction moving forward.

Design Philosophy: The Toolbox Metaphor
Through contextual inquiries, we discovered data science isn't linear but exploratory, iterative, and social. Traditional software paradigms didn't fit.
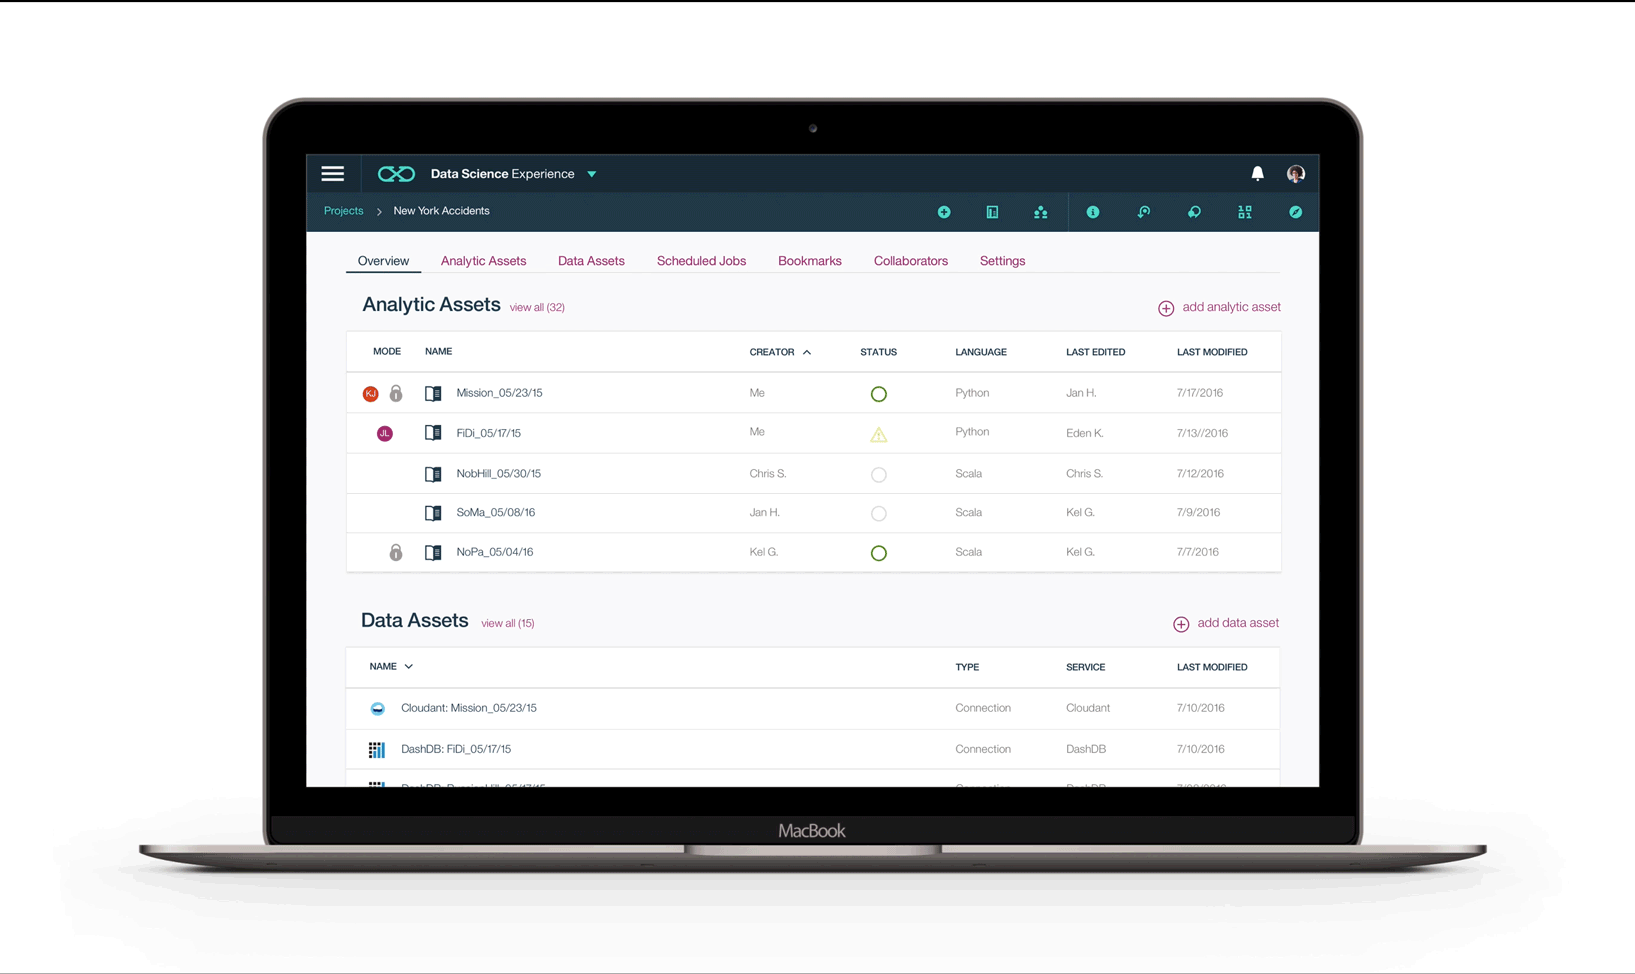
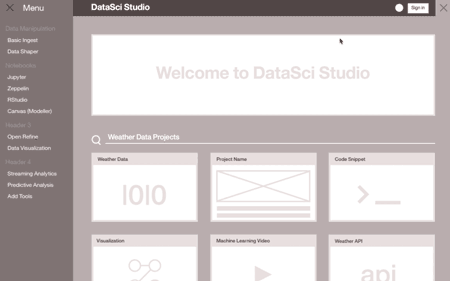
Key Design Innovations
Made every analysis shareable by default with Overview pages for quick scanning and dedicated workspaces for deep work.
Persistent toolbar with common actions plus customizable space for tool-specific functions. Despite development pushback, user testing proved its value.
A collapsible panel where data scientists can search across any asset type (datasets, papers, code, tutorials) from anywhere in the interface. When stuck, the community becomes a peer, tool, and teacher.

Leading with Design
Working at IBM meant operating within a historically engineering-driven culture. We had to constantly advocate for user experience over technical convenience.
- Used research data to build credibility with engineering teams
- Created prototypes to make abstract concepts tangible
- Positioned design decisions within business context
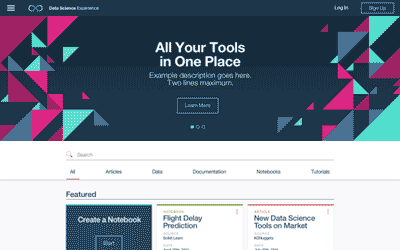
Impact
Product Success
- DSX became the foundation of IBM's current data science and AI business
- Supported thousands of data scientists globally within first few years
- Featured in Forbes as IBM's solution for integrating data across systems
Design Recognition
- Red Dot Design Award (Platform as a Service)
- Webby Award nomination (Best Use of Machine Learning)
- Featured internally as a model for design-led development
Organizational Impact
- Proved design studios could "translate business into products"
- Created reusable framework adopted by subsequent IBM AI products
- Established patterns for distributed design team management
Reflections
This project taught me that transformative design isn't just about interfaces but understanding entire ecosystems. By immersing ourselves in data science culture, we helped reshape how an industry approaches collaboration and learning.
DSX proved that when design leads with user empathy and business acumen, even large organizations can pivot toward human-centered innovation.